Reporting
Overview
The reporting tab allows you to get an overview of your overall productivity over various timeframes. This visibility helps you streamline processes as well as identify areas that need improvement. There are basically three types of reports. The reporting section also allows you export your raw data so that you can bring it into a spreadsheet and create your own custom reports if needed.
Dashboard
This report is focused on the performance of workflows launched from your various workflow templates. The line graph at the top shows you how many flows were completed on time versus flows that were not over various time intervals ranging from the last six months to the last week. 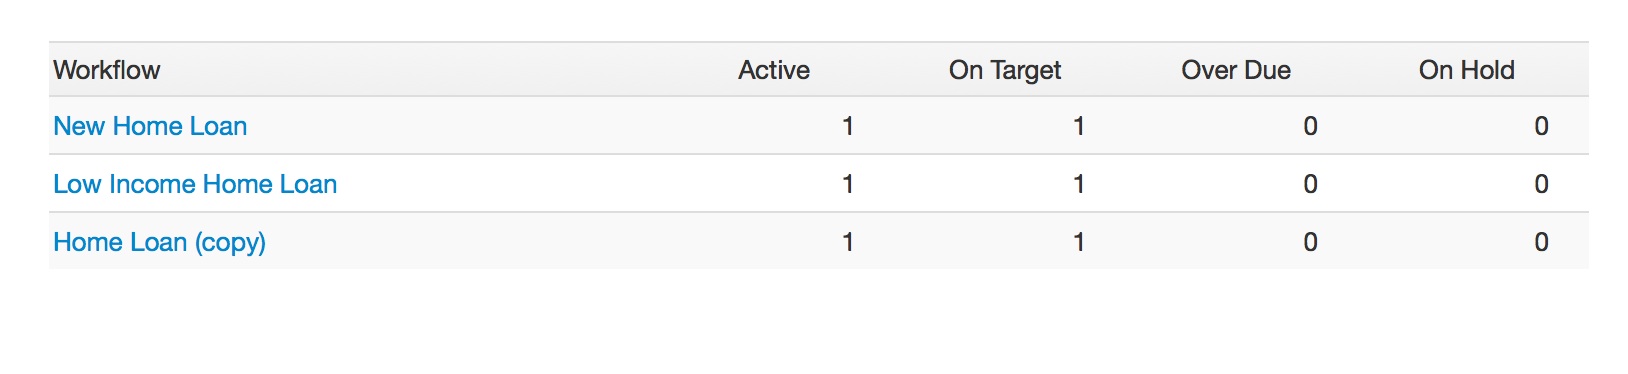 The Pie chart in the lower left shows you what percentage of active flows are on target versus those behind or on hold. The grid in the lower right allows you to select various flow templates to view as well as giving you a count of active flows and their current state.
Workflows
dispite the name this report is focused on the tasks that make up a particular workflow template. The line graph at the top shows you how many of the tasks, the selected team member, completed on target, overdue or were rejected. The Pie chart in the lower left shows you what percentage of active tasks are on target versus those behind, rejected or on hold. The grid in the lower right allows you to select various tasks to view as well as giving you a count of active flows and their current state. This allows you to see particular tasks that are having issues
People
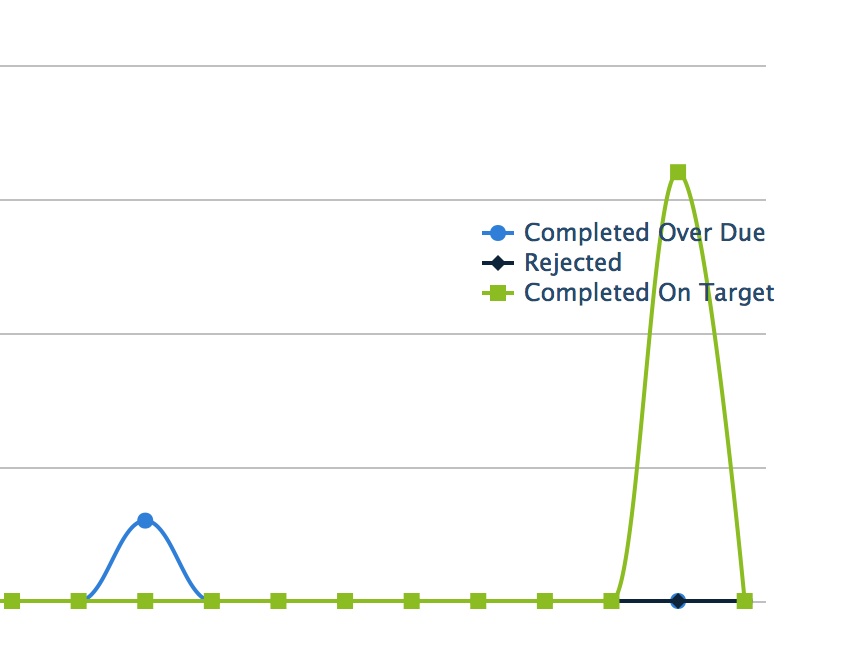 Here we can examine the performance of individual team members over time. The line graph at the top shows you how many of the selected task were completed on target, overdue or rejected over various time intervals ranging from the last six months to the last week. Pro tip: The line graph is interactive you can turn lines on and off by clicking on them in the legend inside the graph.
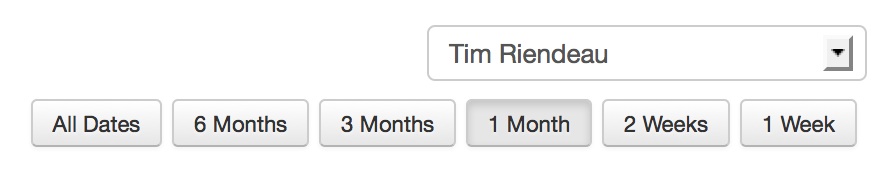
You can select different users to view from the dropdown. You can also select different date ranges by clicking on the appropriate date range button.